Is Your Quality Ecosystem Thriving?
If you cant measure something, you cant improve it - Peter Drucker

When cultivating a thriving team, the impact of best practices is like the soil that nourishes a garden. Just as a gardener must regularly test the soil's pH to ensure the right conditions for plants to flourish, leaders must assess the effectiveness of their teams' practices to foster a culture of quality. Without this critical step, even the most promising initiatives may fail to take root, leaving quality to wither on the vine. By measuring the impact of best practices, you provide the necessary nutrients for your team to grow, innovate, and ultimately, reach its full potential.
Just as different plants in a garden require unique care, each team has distinct needs, and practices that help one team thrive might not suit another. There’s no one-size-fits-all approach to best practices. So, as a quality champion or leader, how do you avoid blind spots, catch early warnings, and identify areas for improvement or even celebrate small wins? The key lies in evaluating practices holistically to ensure your team’s success.
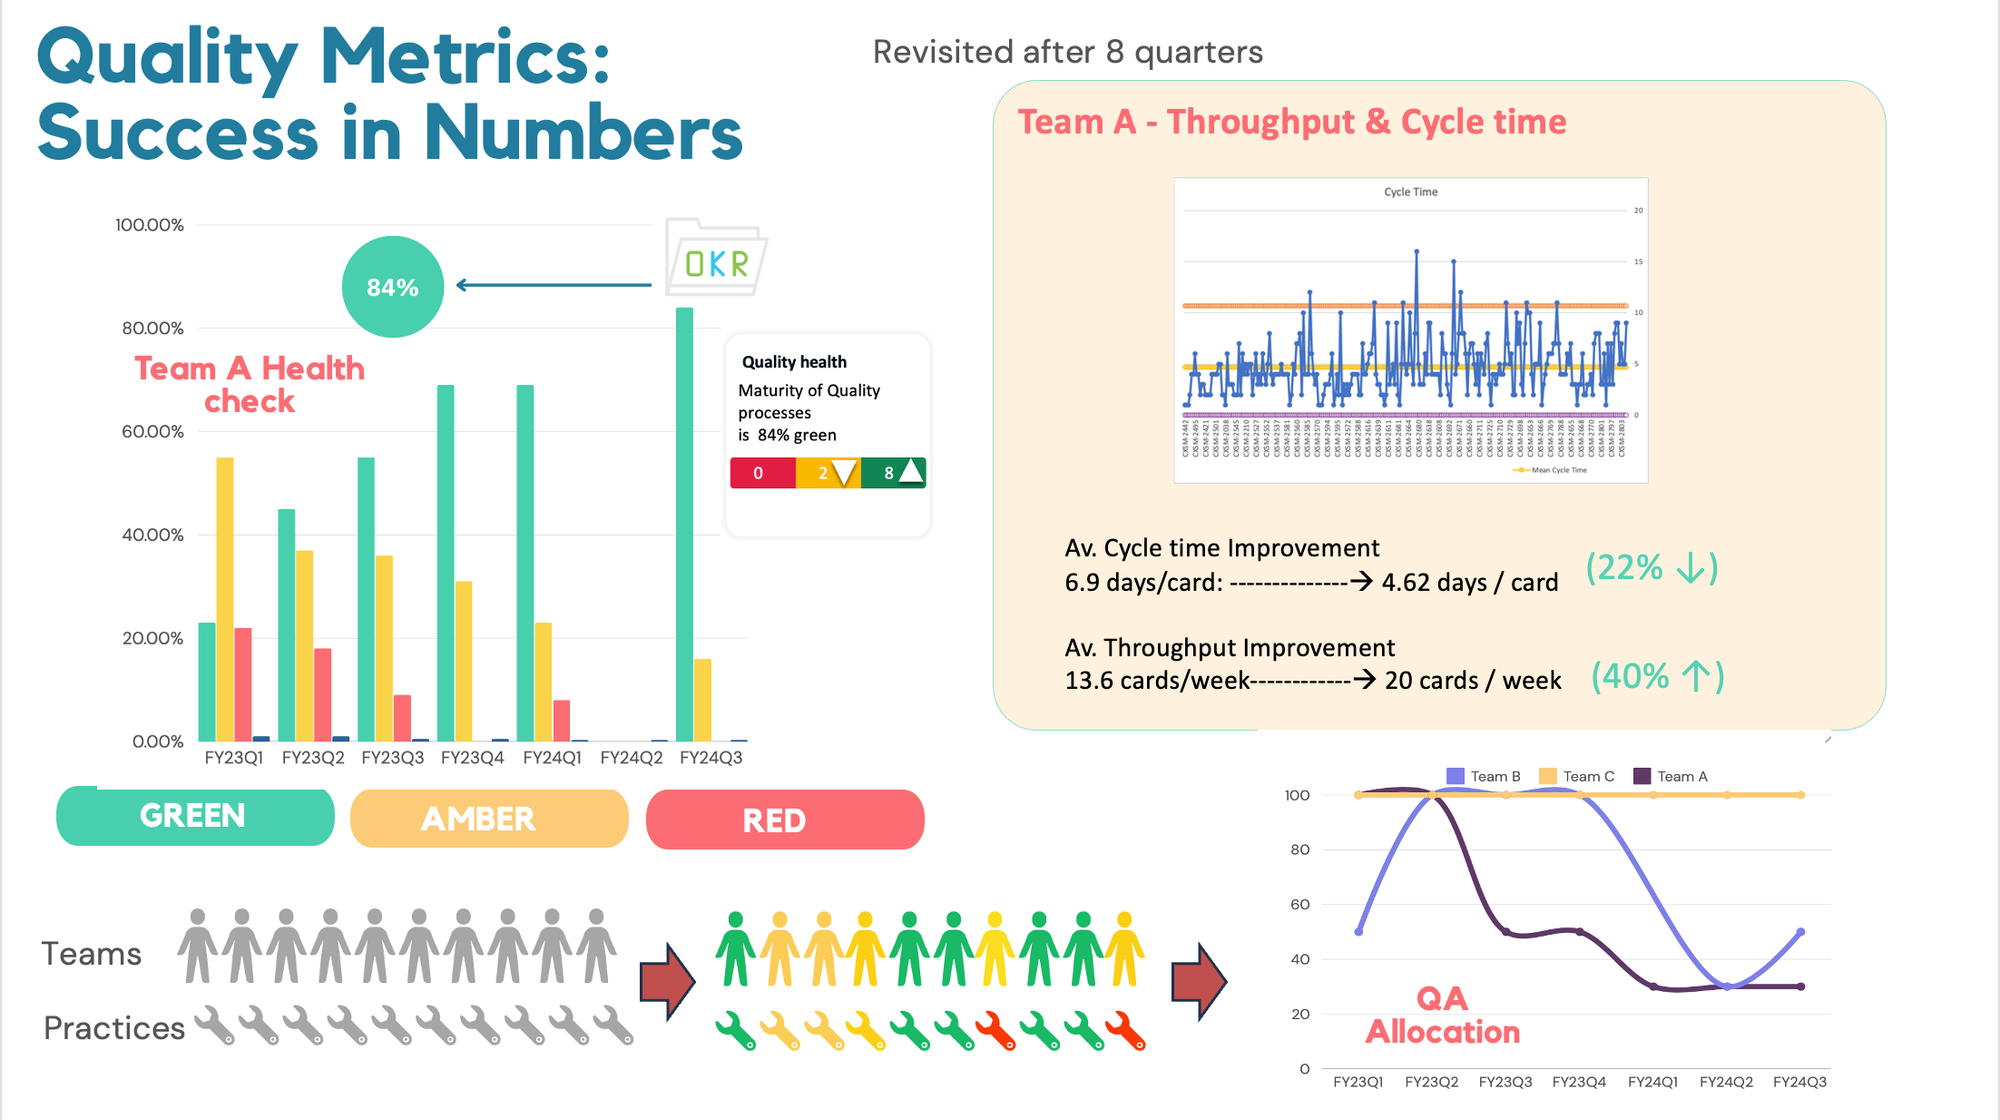
Quality Health check is a strategic review of quality processes within the teams to assess the quality maturity. It examines the effectiveness and benefits of these practices to ensure projects are delivered on time and with confidence.
How do we measure?
We can achieve this by conducting a simple survey that targets the relevant practices impacting quality. Just as healthy soil produces a bountiful garden, happy and safe teams consistently outperform. This survey offers a safe space for team members to share their insights, helping us understand if we’re truly cultivating an environment where quality can thrive. Additionally, it serves as a reminder of the core quality principles, allowing us to realign when necessary. This process reinforces these principles and empowers quality champions to coach effectively and catch early signs of potential issues, ensuring the ongoing health of the team’s work.
Every team member, including the quality champion, participates in a self-assessment survey based on key drivers/criteria to evaluate their quality maturity. To quantify this qualitative data, a rating scale is recommended. While you can use any rating scale, ensure it is consistent across all criteria and teams. Example rating scale:
Strongly Agree = 1, Agree = 2, Neutral = 3, Disagree=4, Strongly Disagree =5
Each lens will yield a traffic light result. Green, Amber or Red based on three rules:
- If any criteria are marked as Agree or Strongly agree, meaning it is GREEN, the team is satisfied with the current practices and understands the value they add. Whilst no specific actions are required,it should continue to be monitored
- If any criteria are marked as Neither Agree or Disagree, meaning it is AMBER team should evaluate how to optimize that practice to improve quality, consider implementing actions to bring the metric back to green
- If any criteria are marked as Disagree or Strongly Disagree, meaning it is RED, the team should prioritise identifying the cause and implement actions to bring the metric back to green. Actions are required to be monitored to completion
A dedicated interactive retro is conducted to go through the outcomes with the team and come up with an improvement plan to tackle the Ambers and the Reds. It is important to take a baseline rating first and reassess it every quarter.
Create the criteria that are tailored to your team
I'm focusing on a few key drivers crucial for a team's success and the quality of their work, though there may be others worth reviewing during the process. This health check adds valuable context to existing metrics, helping us interpret them more effectively. When combined with empirical data, these insights can be used to derive quantitative results, giving a clearer picture of the team’s overall performance and areas for improvement.
" It’s important that the drivers, rating scale, and number of statements/criteria remain consistent across teams to enable group-wide reporting, even though the practices and statements may vary. "
Below are some examples of drivers depending on team maturity. Each driver can have statements tailored to assess the current team’s practices and challenges.
- Collaborative quality efforts: This measures the degree of collaboration between different roles within the team
Ex: Best Practice: Joint Sessions (Kick offs, Bug bash) Between Development, QA, and Product Teams.
Measuring the impact: Monitor the frequency and quality of collaboration in planning sessions. Improved collaboration should lead to fewer misunderstandings and higher shared quality goals.
- Streamlined communication: Effective information flow is crucial to avoid defects caused by misunderstood or missed requirements.
Ex: Best Practice: Implementing Regular Cross-Functional Standups and Backlog Refinement Sessions.
Measuring the impact: Monitor the frequency and effectiveness of these meetings in reducing misunderstandings or missed requirements. A drop in requirement-related defects would indicate a positive impact.
- Distributed quality accountability: This measures how dependent the team is on a dedicated QA. If the QA becomes a bottleneck, it may indicate the need for the team to become more self-reliant.
Ex: Best Practice: Pair Testing and Peer Reviews.
Measuring the impact: Track the extent to which non-QA team members participate in testing and reviews. An increase in participation should reduce the dependency on QA and improve overall quality.
Experience and key learnings:
Running subjective surveys every quarter provides valuable insights into team dynamics and quality practices. However, several challenges have impacted their effectiveness and led to limited improvement:
- Lack of transparency and false positivity: The subjective nature of responses often results in inconsistent feedback, which can obscure clear action items. Ensuring clarity in survey questions and providing examples can help mitigate this issue.
- Limited engagement in retrospectives: Surveys are most effective when coupled with actionable follow-ups, such as retrospectives. Limited engagement in these sessions can hinder the implementation of feedback. Encouraging active participation and clearly communicating the value of retrospectives can enhance their effectiveness and ensure that feedback leads to meaningful changes.
- Survey fatigue Frequent surveys can lead to survey fatigue, which can cause participants to become disengaged or provide less thoughtful responses. To combat this, surveys should be concise and focused on key areas, and their frequency should be balanced with the team's capacity to provide thoughtful feedback.
- Manual reporting burden The process of manually compiling and reporting survey data can be time-consuming and prone to errors. Investing in automated reporting tools can streamline this process, ensuring accuracy and saving time. Additionally, maintaining historical data in an accessible format is essential for tracking progress and making informed decisions.
By addressing these challenges, teams can enhance the effectiveness of subjective surveys and ensure they contribute meaningfully to continuous improvement in quality practices.
Next steps: By integrating qualitative insights from surveys with quantitative metrics like lead time and cycle time, teams can achieve a more holistic view of their performance and drive targeted improvements that enhance both process efficiency and overall quality.
For example, improvements in team collaboration can be monitored against lead time metrics to assess whether better communication leads to faster project delivery.
When starting this with your team, take the time to create criteria on a team-by-team basis, carefully considering current practices. Workshop these criteria with other quality champions across all teams to develop a consistent onboarding plan. Onboard your leadership first to secure buy-in, and work with your leads to ensure the criteria align with your quality vision. Remember, the goal is to embed quality into every facet of the development cycle, making it a shared responsibility.
Why not try an experiment? Take these ideas to your teams, and start integrating these quality metrics and continuous improvement practices.


Comments ()